Thanks for your great service. SocketXP IoT Remote Access Solution works like a charm.
Tobias
freshtaste.de
Remotely monitor the performance & system resources of your Raspberry Pi or IoT 24x7 using SocketXP IoT Remote Management Platform. Get notified via webhook alerts when your device or the IoT app malfunctions.












IoT remote monitoring gives you 24/7 visibility into the health of your IoT devices. It alerts you to potential problems before they impact your business, so you can take action quickly and prevent downtime.

Ensure your IoT devices deliver consistent value with SocketXP’s real-time monitoring. Detect reboots, connection issues, or downtime promptly to take swift action, maintain customer satisfaction, and reduce churn.


Receive instant alerts for device reboots, disconnections, or downtimes, ensuring proactive issue resolution.

Address hardware or software issues quickly to keep your devices running smoothly and reliably.

Prevent customer dissatisfaction by ensuring consistent service and resolving issues before they escalate.
Monitor the CPU, memory, and disk usage of your IoT devices in real time with SocketXP. Get alerted when resource utilization exceeds thresholds, enabling you to take immediate corrective action, enhance performance, and ensure hardware longevity.
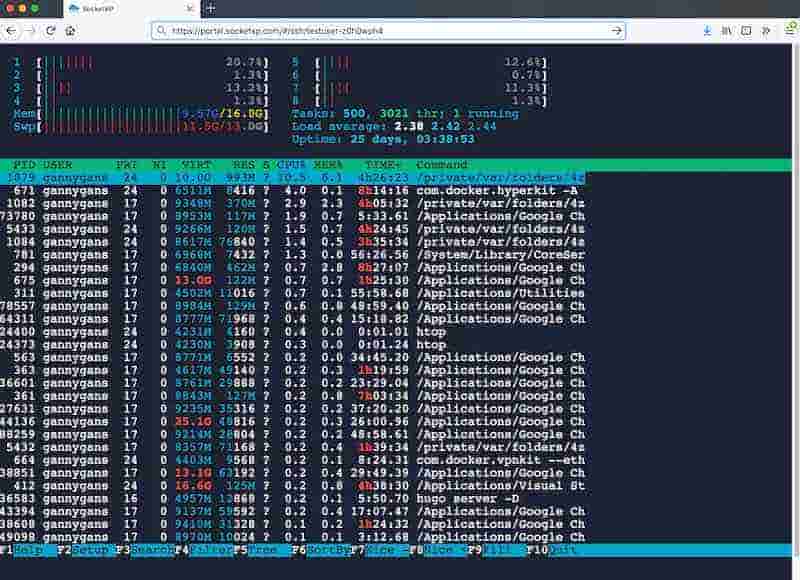

Stay informed about CPU, memory, and disk usage to maintain optimal device efficiency.

Receive instant notifications on performance dips or high resource usage to prevent downtime.

Resolve hardware or software problems with remote RMA swaps or OTA updates to minimize disruptions.
SocketXP’s file monitoring feature keeps track of file changes and log updates on your IoT devices. Get alerts for file modifications or specific error patterns in log files, enabling proactive issue detection and swift corrective action.

SocketXP's file monitoring feature can continuously monitor any file in your IoT devices. It will generate an alert when the file gets modified. It can also be configured to monitor any log file continuously for a specific regex pattern (error log) and generate an alert when a newline matching the regex pattern(error log) gets written into the log file.
Read MoreFind quick answers to the most common questions about this topic.
SocketXP can monitor CPU utilization, memory usage, disk I/O, network bandwidth, device online/offline status, running process health, log file patterns, and custom application metrics via a Python-based monitoring script. You can set thresholds and receive alerts when any metric exceeds them.
SocketXP sends alerts via webhooks, which can be directed to Slack, PagerDuty, Microsoft Teams, or any HTTP endpoint you configure. You can define separate alert rules for device offline events, resource threshold breaches, log file error patterns, and process failures.
Yes. SocketXP tracks device heartbeat and reports the last-seen timestamp. You can configure an alert rule to notify your team when a device goes offline beyond a defined threshold, enabling proactive issue response even for intermittently connected devices.
Yes. SocketXP can continuously tail any log file on a Linux device and trigger an alert when a line matching a configurable regex pattern is written—for example, when an error or exception is logged by your application.
SocketXP's process monitoring feature checks whether a named Linux process, daemon, or service is active. If the process stops unexpectedly, SocketXP triggers an alert via webhook so your team can respond immediately—before customers or end-users are affected.
Yes. You can write a Python monitoring script that reads any metric your application exposes—database query counts, queue depths, sensor readings, API response times—and report it to SocketXP. Alerts fire when those custom metrics breach your defined thresholds.
SocketXP detects device disconnection within seconds of the heartbeat being lost and triggers your configured webhook alert almost immediately. You can tune the sensitivity—for example, only alert if a device is offline for more than 5 minutes—to avoid noise from brief network blips.
Yes. SocketXP's custom Python monitoring hook can read any value accessible from Linux—including thermal zone temperatures via /sys/class/thermal, battery status, GPIO sensor data, or vendor-specific hardware APIs. You define the metric, the threshold, and the alert destination.
Traditional tools like Nagios and Datadog are designed for data-centre servers on stable, routable networks—they require the monitored host to be reachable from the monitoring server. SocketXP is built for field-deployed IoT devices behind NAT routers, firewalls, and cellular networks with no public IP. SocketXP's agent-based model handles intermittent connectivity, offline detection, and works over any network without needing an open inbound port.
Hear from our satisfied customers about how SocketXP has transformed their IoT workflows with seamless connectivity, robust security, and unmatched reliability.