
Short answer: Grafana doesn’t store MQTT data, so you need a pipeline. Mosquitto receives the messages, Telegraf’s mqtt_consumer subscribes and turns topics into tags, InfluxDB stores the time series, and Grafana queries InfluxDB for dashboards and alerts. Put site and device_id in the topic and numeric metrics in a flat JSON payload. Grafana will then draw one line per device without any extra work.
In this guide
- Shaping MQTT payloads so Grafana charts them cleanly
- A complete Telegraf config: telemetry, online/offline status and broker metrics
- Provisioning the Grafana data source and dashboards from files
- Six panels with ready-to-paste Flux queries, plus site and device dropdowns
- Grafana alerts that don’t flood you during a site outage
- Downsampling for a year of history without a huge database
Get the code: the provisioned data source and the finished dashboard (grafana/dashboards/iot-fleet.json) are in the mqtt-iot-monitoring folder of ampaslabs/socketxp-blog-tutorials on GitHub. Run docker compose up -d and the dashboard is ready in Grafana.
Every query in this guide was run against Grafana 11.3.0 and InfluxDB 2.7 with live data from simulated devices.
This article builds on the Docker Compose stack in MQTT IoT Monitoring with Mosquitto. If you don’t have Mosquitto, Telegraf, InfluxDB and Grafana running yet, start there. We’ll replace that guide’s Telegraf config and add Grafana provisioning.
The Data Flow
device ──► fleet/site1/device01/telemetry   {"cpu":12.5,"mem":43.1,"temp":51.2,"fw":"1.4.2"}
device ──► fleet/site1/device01/status      online / offline  (retained, Last Will)
broker ──► $SYS/broker/clients/connected    42

                Telegraf mqtt_consumer
                         │
                         ▼
 InfluxDB bucket "telemetry"
   measurement   tags                          fields
   telemetry     site, device_id, fw           cpu, mem, disk, temp, uptime
   status        site, device_id               up (1 = online, 0 = offline)
   mosquitto     topic                         value
                         │
                         ▼
                 Grafana (Flux queries)
Step 1: Shape the Payload for Grafana
The way you structure messages determines how easy the dashboard is to build. Three rules:
- Identity goes in the topic. Use
fleet/{site}/{device_id}/telemetry. Telegraf turns those topic levels into tags for free. - Use a flat JSON payload with numeric metrics. Write
{"cpu": 12.5, "temp": 51.2}, not{"cpu": {"value": 12.5, "unit": "%"}}. Units belong in Grafana’s panel settings, not in every message. - Only low-cardinality labels become tags. Firmware version, hardware model and region are good tags. A timestamp, a reading ID or a free-text error message must never be a tag, because every unique tag value creates a new series in InfluxDB and memory use grows with them.
| Payload key | Store as | Why |
|---|---|---|
cpu, mem, disk, temp, uptime | Field (float) | Charted and aggregated |
fw (firmware version) | Tag | Filter and group by; a handful of distinct values |
model_version (AIoT) | String field | Shown in tables; changes often across the fleet |
error text | String field, or don’t send it | Unbounded values; never a tag |
Step 2: Telegraf Configuration
This replaces telegraf/telegraf.conf from the main guide. It adds the retained status topics and the firmware tag:
[agent]
  interval = "10s"
  flush_interval = "10s"

[[outputs.influxdb_v2]]
  urls = ["http://influxdb:8086"]
  token = "${INFLUX_TOKEN}"
  organization = "iot"
  bucket = "telemetry"

# 1. Device telemetry (JSON)
[[inputs.mqtt_consumer]]
  servers = ["tcp://mosquitto:1883"]
  topics = ["fleet/+/+/telemetry"]
  qos = 0
  client_id = "telegraf-telemetry"
  username = "telegraf"
  password = "${MQTT_TELEGRAF_PASSWORD}"
  data_format = "json"
  tag_keys = ["fw"]
  json_string_fields = ["model_version"]

  [[inputs.mqtt_consumer.topic_parsing]]
    topic = "fleet/+/+/telemetry"
    measurement = "_/_/_/measurement"
    tags = "_/site/device_id/_"

# 2. Online/offline status (retained, plain string payload)
[[inputs.mqtt_consumer]]
  servers = ["tcp://mosquitto:1883"]
  topics = ["fleet/+/+/status"]
  qos = 1
  client_id = "telegraf-status"
  username = "telegraf"
  password = "${MQTT_TELEGRAF_PASSWORD}"
  data_format = "value"
  data_type = "string"

  [[inputs.mqtt_consumer.topic_parsing]]
    topic = "fleet/+/+/status"
    measurement = "_/_/_/measurement"
    tags = "_/site/device_id/_"

# Map "online"/"offline" to 1/0 so Grafana can plot it
[[processors.enum]]
  namepass = ["status"]
  [[processors.enum.mapping]]
    field = "value"
    dest = "up"
    [processors.enum.mapping.value_mappings]
      online = 1
      offline = 0

# 3. Broker health from Mosquitto $SYS topics
[[inputs.mqtt_consumer]]
  servers = ["tcp://mosquitto:1883"]
  topics = [
    "$SYS/broker/clients/connected",
    "$SYS/broker/subscriptions/count",
    "$SYS/broker/load/messages/received/1min",
    "$SYS/broker/load/messages/sent/1min",
  ]
  client_id = "telegraf-sys"
  username = "telegraf"
  password = "${MQTT_TELEGRAF_PASSWORD}"
  name_override = "mosquitto"
  data_format = "value"
  data_type = "float"
Allow Telegraf to read the status topics in the Mosquitto ACL file, then restart both services:
user telegraf
topic read fleet/+/+/telemetry
topic read fleet/+/+/status
topic read $SYS/#
docker compose restart mosquitto telegraf
docker compose logs --tail 20 telegraf
Because status messages are retained, Telegraf receives every device’s current status as soon as it subscribes. Your status panel won’t start out empty.
Check that data is arriving before you open Grafana (run source .env first so $INFLUX_TOKEN is set in your shell):
docker compose exec influxdb influx query --org iot --token "$INFLUX_TOKEN" '
from(bucket: "telemetry")
  |> range(start: -5m)
  |> group(columns: ["_measurement"])
  |> count()'
You should see non-zero counts for telemetry, status and mosquitto.
Step 3: Provision Grafana from Files
Clicking through the UI works once, but provisioning from files makes the setup repeatable. Add these files to the project:
grafana/
├── provisioning/
│   ├── datasources/influxdb.yml
│   └── dashboards/iot.yml
└── dashboards/            ← exported dashboard JSON lives here
grafana/provisioning/datasources/influxdb.yml
apiVersion: 1
datasources:
  - name: InfluxDB
    uid: influxdb
    type: influxdb
    access: proxy
    url: http://influxdb:8086
    isDefault: true
    jsonData:
      version: Flux
      organization: iot
      defaultBucket: telemetry
    secureJsonData:
      token: $INFLUX_TOKEN
grafana/provisioning/dashboards/iot.yml
apiVersion: 1
providers:
  - name: iot
    folder: IoT Fleet
    type: file
    allowUiUpdates: true
    options:
      path: /var/lib/grafana/dashboards
Update the grafana service in docker-compose.yml:
  grafana:
    image: grafana/grafana:11.3.0
    ports:
      - "127.0.0.1:3000:3000"
    environment:
      INFLUX_TOKEN: ${INFLUX_TOKEN}
      GF_SECURITY_ADMIN_PASSWORD: ${GRAFANA_ADMIN_PASSWORD}
    volumes:
      - grafana-data:/var/lib/grafana
      - ./grafana/provisioning:/etc/grafana/provisioning:ro
      - ./grafana/dashboards:/var/lib/grafana/dashboards:ro
    depends_on: [influxdb]
    restart: unless-stopped
Add GRAFANA_ADMIN_PASSWORD to .env and run docker compose up -d grafana. Check the data source with curl -u admin:<password> localhost:3000/api/datasources/uid/influxdb/health, which should return "status":"OK". The InfluxDB data source is now present on every fresh install. After you build the dashboard below, use Export → Save to file and drop the JSON into grafana/dashboards/ so it’s provisioned too, and keep that folder in git.
Step 4: Dashboard Variables
Create a new dashboard and add two variables under Settings → Variables. They give you a site dropdown and a device dropdown, so one dashboard serves the whole fleet.
site (Query, single value, include “All” off):
import "influxdata/influxdb/schema"
schema.tagValues(bucket: "telemetry", tag: "site")
device (Query, multi-value, include “All” on):
import "influxdata/influxdb/schema"
schema.tagValues(
  bucket: "telemetry",
  tag: "device_id",
  predicate: (r) => r.site == "${site}",
)
In panel queries, filter with r.device_id =~ /^${device:regex}$/. The :regex format turns a multi-selection into (device01|device02).
Step 5: The Six Panels
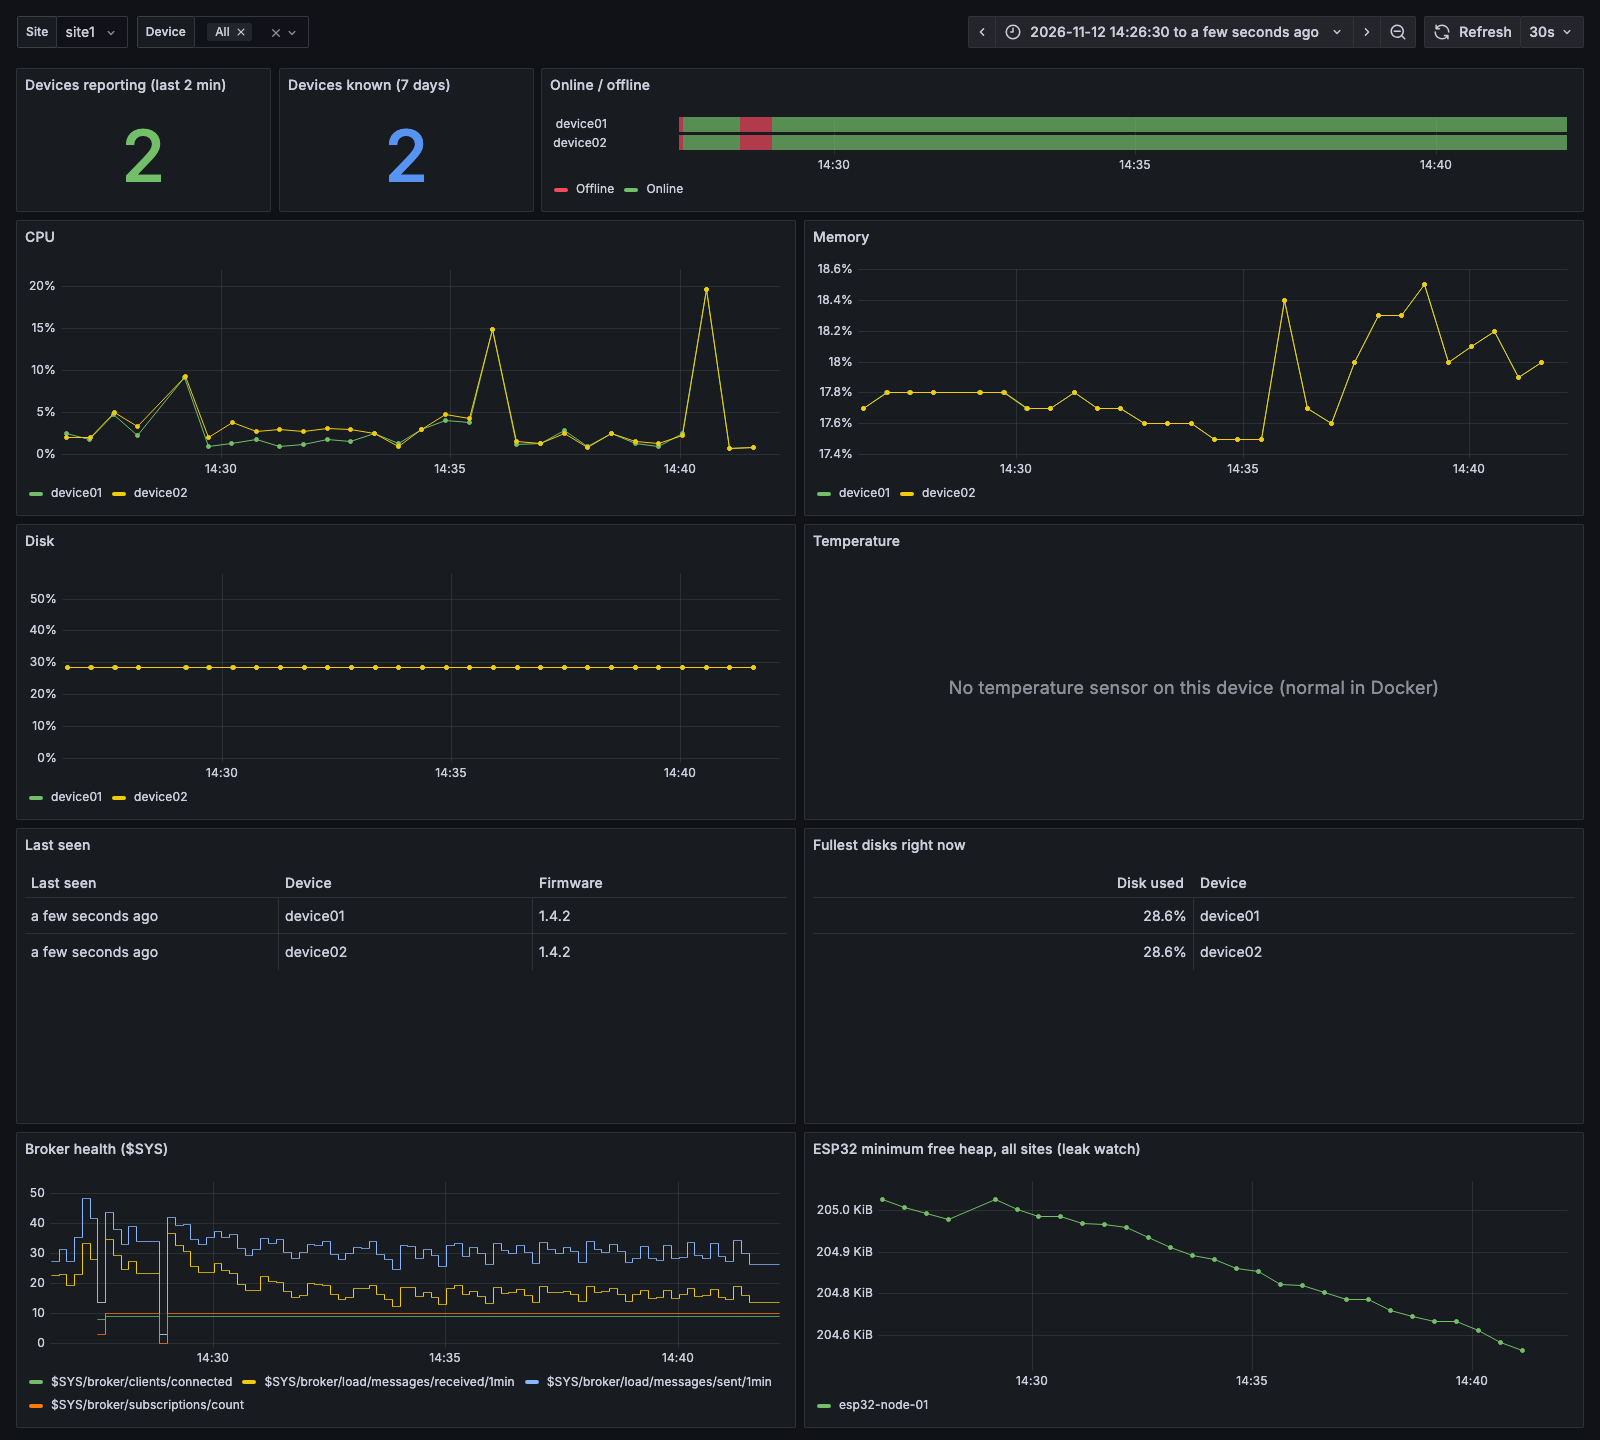
Here’s the finished dashboard. Each panel’s query follows.
The MQTT IoT Fleet dashboard from the companion repo, running against live data from simulated devices. The red blocks in the timeline are from two broker restarts during testing.
1. Devices reporting (Stat)
This counts devices that have sent telemetry in the last 2 minutes. It’s based on data actually arriving, so it also counts devices whose MQTT session is up but whose app is hung as not reporting.
from(bucket: "telemetry")
  |> range(start: -2m)
  |> filter(fn: (r) => r._measurement == "telemetry" and r._field == "uptime")
  |> filter(fn: (r) => r.site == "${site}")
  |> last()
  |> group()
  |> count()
Add a second Stat panel with the total device count for the site (the same query with range(start: -7d)). Showing “38 / 40 reporting” side by side makes problems obvious.
2. CPU, memory and temperature per device (Time series)
from(bucket: "telemetry")
  |> range(start: v.timeRangeStart, stop: v.timeRangeStop)
  |> filter(fn: (r) => r._measurement == "telemetry" and r._field == "cpu")
  |> filter(fn: (r) => r.site == "${site}" and r.device_id =~ /^${device:regex}$/)
  |> aggregateWindow(every: v.windowPeriod, fn: mean, createEmpty: false)
Set the unit to Percent (0–100) and the legend display name to ${__field.labels.device_id}. Duplicate the panel for mem, disk and temp (unit Celsius, threshold line at 80).
3. Last seen (Table)
from(bucket: "telemetry")
  |> range(start: -7d)
  |> filter(fn: (r) => r._measurement == "telemetry" and r._field == "uptime")
  |> filter(fn: (r) => r.site == "${site}")
  |> last()
  |> group()
  |> keep(columns: ["device_id", "fw", "_time"])
  |> sort(columns: ["_time"])
Add a field override on _time: set the unit to From Now and the cell type to Colored text, with thresholds. The longest-silent devices appear at the top of the table, as “14 minutes ago” in red.
4. Online/offline history (State timeline)
from(bucket: "telemetry")
  |> range(start: v.timeRangeStart, stop: v.timeRangeStop)
  |> filter(fn: (r) => r._measurement == "status" and r._field == "up")
  |> filter(fn: (r) => r.site == "${site}" and r.device_id =~ /^${device:regex}$/)
Add value mappings 1 → Online (green) and 0 → Offline (red). Each device gets a horizontal bar, and flapping devices stand out immediately as striped red and green. The Last Will messages behind this panel are explained in Detect Offline IoT Devices with MQTT Last Will and Heartbeats.

Online/offline history built from retained status and Last Will messages. The red blocks are two broker restarts during testing; both devices reconnected and reported online again within a minute.
5. Hottest devices right now (Table or Bar gauge)
from(bucket: "telemetry")
  |> range(start: -5m)
  |> filter(fn: (r) => r._measurement == "telemetry" and r._field == "temp")
  |> filter(fn: (r) => r.site == "${site}")
  |> last()
  |> group()
  |> keep(columns: ["device_id", "_value"])
  |> sort(columns: ["_value"], desc: true)
  |> limit(n: 10)
Swap temp for disk to get a “disks filling up” panel. That’s one of the most common causes of field failures.
6. Broker health (Time series)
from(bucket: "telemetry")
  |> range(start: v.timeRangeStart, stop: v.timeRangeStop)
  |> filter(fn: (r) => r._measurement == "mosquitto")
  |> aggregateWindow(every: v.windowPeriod, fn: last, createEmpty: true)
  |> fill(usePrevious: true)
fill(usePrevious: true) matters here. Mosquitto only publishes a $SYS value when it changes, so a steady client count leaves gaps, and without the fill its line disappears from the chart.
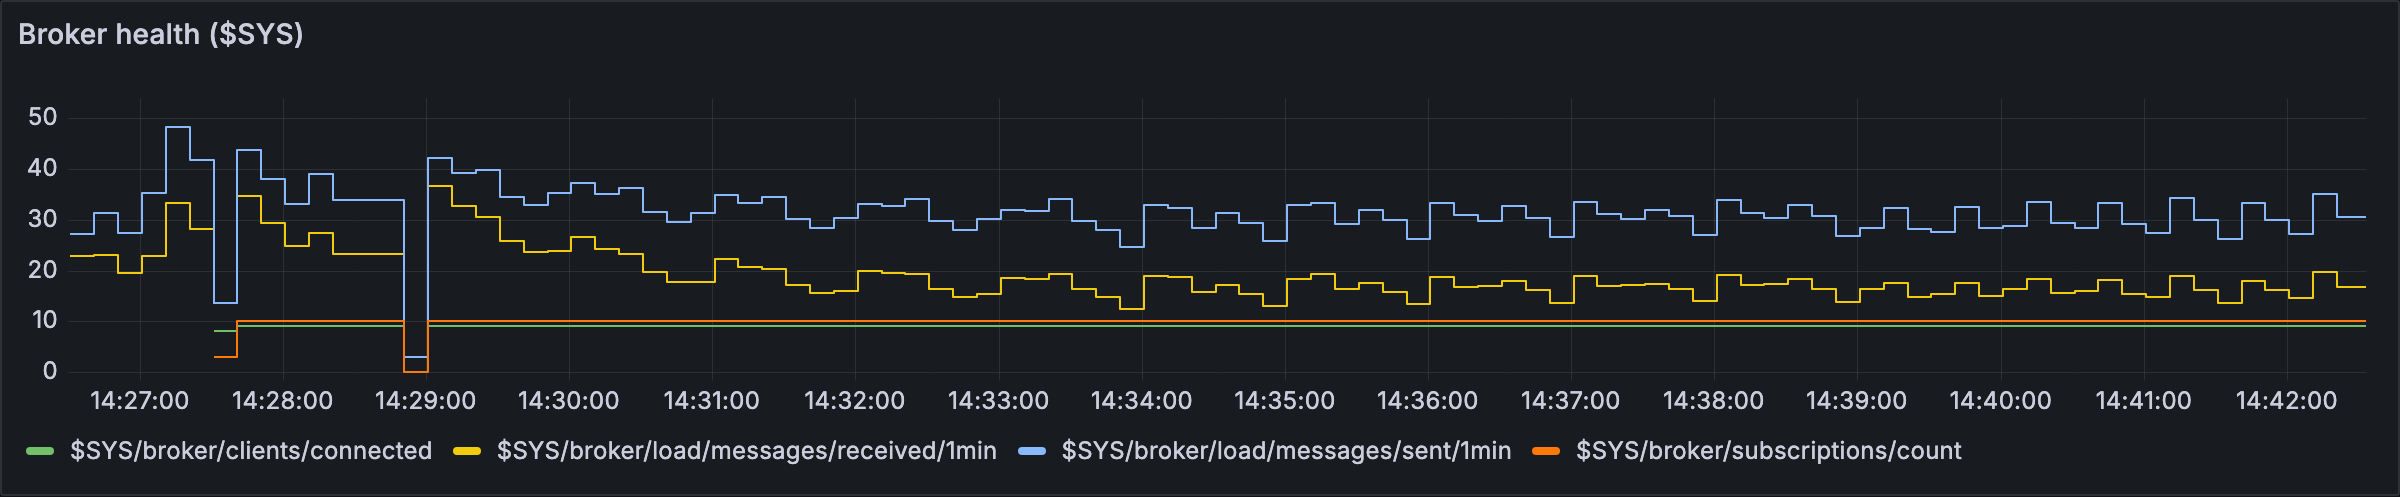
Mosquitto $SYS broker metrics in Grafana. The dips around 14:28 and 14:29 are broker restarts; connected clients and subscriptions recover right away.
Set the legend to ${__field.labels.topic}. Put connected clients on the left axis and message rates on the right. A sudden drop in connected clients alongside a flat message rate usually points to a network problem at one site, not a broker problem.
Step 6: Alert Rules That Don’t Flood You
Grafana-managed alert rules carry over the InfluxDB tags as labels, so every alert knows its site and device_id. Create these under Alerting → Alert rules:
| Rule | Query (reduce) | Condition | Pending period | No data |
|---|---|---|---|---|
| Device silent | uptime, last over 5 min, per device | n/a | 5 min | Alerting |
| High CPU | cpu, mean over 10 min | > 90 | 10 min | OK |
| Disk almost full | disk, last | > 85 | 15 min | OK |
| Overheating | temp, last | > 80 | 5 min | OK |
| Broker clients dropped | clients/connected, last vs 15 min ago | < 80 % | 5 min | OK ($SYS values are only published when they change) |
To keep alerts manageable:
- Group notifications by
sitein the notification policy. A site losing power then sends one notification listing 40 devices, not 40 notifications. - Use the pending period. It’s the difference between “CPU spiked during an update” and “CPU has been pegged for 10 minutes”.
- Send alerts to a contact point such as Slack, Microsoft Teams, PagerDuty or a generic webhook. Add the dashboard URL with the
devicevariable pre-filled to the message template, so the on-call engineer lands on the right device.
Step 7: Retention and Downsampling
Raw 30-second telemetry adds up quickly. 100 devices × 5 fields × 2,880 readings a day is about 1.4 million values per day. Keep raw data short and averages long:
# Create a long-retention bucket for 5-minute averages
docker compose exec influxdb influx bucket create \
  --org iot --token "$INFLUX_TOKEN" --name telemetry_5m --retention 365d
Then create an InfluxDB task (Tasks → Create task in the InfluxDB UI, or influx task create):
option task = {name: "downsample-telemetry-5m", every: 5m}

from(bucket: "telemetry")
  |> range(start: -task.every)
  |> filter(fn: (r) => r._measurement == "telemetry")
  |> filter(fn: (r) => contains(value: r._field, set: ["cpu", "mem", "disk", "temp", "uptime"]))
  |> aggregateWindow(every: 5m, fn: mean, createEmpty: false)
  |> to(bucket: "telemetry_5m")
The field filter matters: mean only works on numbers, so string fields such as model_version must be left out.
Point long-range panels (30 days and longer) at telemetry_5m. They’ll load in milliseconds instead of scanning millions of raw points.
How SocketXP Complements Your MQTT Grafana Dashboard
A dashboard shows you which device is at 97% disk or has stopped reporting. It can’t clear the disk or ship the fix. SocketXP is an IoT device management and remote access platform that covers that part:
- Remote access to the device behind the red panel. SSH, VNC, RDP or a browser terminal, even behind NAT, CGNAT or cellular, with no VPN or open ports. Use SFTP to pull logs off the device.
- Fleet-wide commands. Run the same cleanup or diagnostic command across a device group instead of logging in one by one.
- OTA updates with a safety net. Push firmware, binaries, Debian packages or Docker images to a pilot group, check the dashboard, then roll out to the fleet. Staged rollouts, scheduling, rollback through your install script’s health check, and per-device status come built in. The
fwcolumn in the last-seen table shows the rollout progress. - Independent health alerts. The SocketXP agent raises its own online/offline and resource alerts, so you still hear about problems if the MQTT pipeline is the thing that broke.
- Edge AI fleets. Chart
inference_msandmodel_versionnext to CPU and temperature, then watch a model rolled out OTA move across the fleet.
The same agent can also share the local-only Grafana with your team over HTTPS (socketxp connect http://localhost:3000), without a reverse proxy. Keep Grafana’s own login enabled.
For the full side-by-side comparison, see How SocketXP complements your MQTT monitoring setup.
Next Steps
- The full self-hosted stack: MQTT IoT Monitoring with Mosquitto
- Make the status timeline reliable: Detect Offline IoT Devices with MQTT Last Will and Heartbeats
- Secure the data path: MQTT mTLS Authentication Setup
Frequently Asked Questions
Can Grafana read MQTT data directly?
Grafana has an MQTT data source plugin that can show live values from a broker, but it doesn't store history. For IoT monitoring you normally store MQTT messages in a time-series database such as InfluxDB using Telegraf's mqtt_consumer input, then point Grafana at the database.
How do I get the device ID from the MQTT topic into Grafana?
Use Telegraf's topic_parsing option in mqtt_consumer. For a topic like fleet/site1/device01/telemetry, set tags = "_/site/device_id/_" and Telegraf stores site and device_id as InfluxDB tags. Grafana then draws one series per device and can filter by them.
How do I show online/offline status in Grafana?
Subscribe Telegraf to the retained status topics with the value parser (data_type = string), map 'online' to 1 and 'offline' to 0 with the enum processor, then use a Grafana State timeline panel with value mappings 1 = Online and 0 = Offline.
How do I alert when an MQTT device stops sending data?
Create a Grafana-managed alert rule on a per-device query and set 'Alert state if no data' to Alerting. If a device's series stops for longer than the pending period, Grafana fires an alert labelled with that device_id.
How long should I keep IoT telemetry in InfluxDB?
A common pattern is raw data for 7 to 30 days, plus downsampled 5-minute or hourly averages for a year or more. An InfluxDB task writes the averages into a second bucket with longer retention.
Should I use InfluxQL or Flux with Grafana?
Both work with InfluxDB 2.x. This guide uses Flux because it's the native language for InfluxDB 2.x buckets and supports joins, maps and tasks. If you move to InfluxDB 3, use SQL or InfluxQL instead; the dashboard structure stays the same.