
Short answer: MQTT IoT monitoring means each device publishes its health and sensor data to an MQTT broker, which a collector stores in a time-series database for dashboards and alerts. A practical self-hosted stack is open-source Mosquitto (broker), Telegraf (collector), InfluxDB (storage) and Grafana (dashboards and alerts). For offline detection, combine MQTT’s Last Will and Testament with a heartbeat timeout.
What you’ll build
- A self-hosted MQTT monitoring stack with Mosquitto, Telegraf, InfluxDB and Grafana, run with Docker Compose
- A Python device agent that publishes CPU, memory, disk and temperature every 30 seconds
- Offline detection with retained Last Will messages plus a heartbeat watchdog
- Broker health monitoring from Mosquitto’s
$SYStopics - What the monitoring stack can’t do, and how SocketXP adds remote access, OTA updates and fleet management
Get the code: ampaslabs/socketxp-blog-tutorials on GitHub, in the mqtt-iot-monitoring folder (MIT licensed). One docker compose up starts the full stack, with simulated devices, a ready-made Grafana dashboard and failure scenarios you can run.
Everything in this series was tested end to end in Docker with Mosquitto 2.1.2, Telegraf 1.32, InfluxDB 2.7, Grafana 11.3.0, Python 3.12 and paho-mqtt 2.1.0.
What Is MQTT IoT Monitoring?
MQTT (Message Queuing Telemetry Transport) is a lightweight publish/subscribe protocol. Devices publish messages to named topics on a central broker, and any number of subscribers receive them. Publishers and subscribers never talk to each other directly.
For monitoring, that model works well:
- Push, not poll. Devices send data when they have it. You don’t need to reach into each device, which matters when it sits behind NAT or on a cellular link.
- Small overhead. The fixed MQTT header is 2 bytes. A 100-byte JSON reading every 30 seconds is only about 0.3 MB of payload per device per day.
- Built-in liveness. Keepalive and Last Will and Testament (LWT) let the broker announce when a device drops off.
- Retained messages. A new dashboard or subscriber immediately receives each device’s last known status.
- Fan-out. One telemetry stream can feed a database, an alerting service and an AI pipeline at the same time.
There are two kinds of MQTT monitoring, and this guide covers both:
- Monitoring IoT devices through MQTT: telemetry, heartbeats and offline detection. This is the main focus.
- Monitoring the MQTT broker itself: connected clients and message rates, covered in the
$SYSsection below.
MQTT IoT Monitoring Architecture
  IoT devices (Raspberry Pi, Jetson, gateways, ESP32)
     │  publish  fleet/{site}/{device_id}/telemetry   (JSON, QoS 0)
     │  publish  fleet/{site}/{device_id}/status      (online/offline, QoS 1, retained, LWT)
     ▼
  ┌──────────────────────┐
  │  Mosquitto broker    │──── $SYS/broker/...  (broker health)
  └──────────┬───────────┘
             │ subscribe
     ┌───────┴─────────────────────┐
     ▼                             ▼
  Telegraf                     Offline watchdog (Python)
  (mqtt_consumer)              • LWT "offline" → alert
     │                         • 3 missed heartbeats → alert
     ▼                             │
  InfluxDB  ──►  Grafana           ▼
  (time series)  (dashboards,   fleet/{site}/{device_id}/alerts + webhook
                  alert rules)    (Slack, Teams, PagerDuty)
Each component does one job and can be swapped out. For example, you can use Node-RED instead of Telegraf, TimescaleDB or Prometheus instead of InfluxDB, or EMQX or HiveMQ instead of Mosquitto. This guide uses the most common fully open-source combination.
Step 1: Design Your MQTT Topic Structure
Topic design is the decision that’s hardest to change later. Put the identity in the topic and the measurements in the payload:
| Topic | Payload | QoS | Retained | Published by |
|---|---|---|---|---|
fleet/{site}/{device_id}/telemetry | JSON metrics, e.g. {"cpu":12.5,"mem":43.1} | 0 | No | Device, every 30 s |
fleet/{site}/{device_id}/status | online / offline | 1 | Yes | Device on connect; broker as LWT |
fleet/{site}/{device_id}/alerts | JSON alert event | 1 | No | Watchdog |
fleet/{site}/{device_id}/cmd | Command, e.g. reboot | 1 | No | Operator or backend |
Why this layout works:
- Wildcards stay simple.
fleet/+/+/telemetrymatches every device’s telemetry, andfleet/site1/#matches everything at one site. - Collectors can tag by topic. Telegraf can turn
siteanddevice_idinto database tags without parsing the payload. - ACLs become one line. A device can be limited to
fleet/+/<its-own-id>/#.
Avoid leading slashes (/fleet/...), spaces and personal data in topic names. Never use # as a device’s publish topic.
Step 2: Choosing MQTT QoS for Monitoring
| Message type | Recommended QoS | Why |
|---|---|---|
| Periodic telemetry | 0 (at most once) | The next reading replaces a lost one. This gives the lowest overhead. |
| Status / Last Will | 1 + retained | It must arrive, and new subscribers need the latest value. |
| Alerts | 1 (at least once) | A duplicate alert is better than a missed one. |
| Commands (reboot, config) | 1, with idempotent handlers | Make repeated delivery harmless. |
QoS 2 (exactly once) is rarely worth its four-packet handshake for monitoring data.
Step 3: Run Mosquitto, Telegraf, InfluxDB and Grafana with Docker Compose
Create a project directory with this layout:
mqtt-monitoring/
├── .env
├── docker-compose.yml
├── mosquitto/config/
│   ├── mosquitto.conf
│   ├── passwd
│   └── acl
└── telegraf/
    └── telegraf.conf
Put the secrets in .env. Generate your own long random values and never commit this file:
INFLUX_PASSWORD=change-me-influx-admin
INFLUX_TOKEN=change-me-long-random-token
MQTT_TELEGRAF_PASSWORD=change-me-telegraf
docker-compose.yml
services:
  mosquitto:
    image: eclipse-mosquitto:2
    ports:
      - "1883:1883"
    volumes:
      - ./mosquitto/config:/mosquitto/config
      - mosquitto-data:/mosquitto/data
    restart: unless-stopped

  influxdb:
    image: influxdb:2.7
    environment:
      DOCKER_INFLUXDB_INIT_MODE: setup
      DOCKER_INFLUXDB_INIT_USERNAME: admin
      DOCKER_INFLUXDB_INIT_PASSWORD: ${INFLUX_PASSWORD}
      DOCKER_INFLUXDB_INIT_ORG: iot
      DOCKER_INFLUXDB_INIT_BUCKET: telemetry
      DOCKER_INFLUXDB_INIT_RETENTION: 30d
      DOCKER_INFLUXDB_INIT_ADMIN_TOKEN: ${INFLUX_TOKEN}
    volumes:
      - influxdb-data:/var/lib/influxdb2
    restart: unless-stopped

  telegraf:
    image: telegraf:1.32
    environment:
      INFLUX_TOKEN: ${INFLUX_TOKEN}
      MQTT_TELEGRAF_PASSWORD: ${MQTT_TELEGRAF_PASSWORD}
    volumes:
      - ./telegraf/telegraf.conf:/etc/telegraf/telegraf.conf:ro
    depends_on: [mosquitto, influxdb]
    restart: unless-stopped

  grafana:
    image: grafana/grafana:11.3.0
    ports:
      - "127.0.0.1:3000:3000"   # local only; see "How SocketXP Complements Your MQTT Monitoring Setup" to share it
    volumes:
      - grafana-data:/var/lib/grafana
    depends_on: [influxdb]
    restart: unless-stopped

volumes:
  mosquitto-data:
  influxdb-data:
  grafana-data:
InfluxDB isn’t published on a host port at all. Telegraf and Grafana reach it over the internal Docker network at http://influxdb:8086. Pin image versions in production and upgrade them deliberately.
mosquitto/config/mosquitto.conf
listener 1883
allow_anonymous false
password_file /mosquitto/config/passwd
acl_file /mosquitto/config/acl

# Keep retained status messages across broker restarts
persistence true
persistence_location /mosquitto/data/

# Publish broker metrics on $SYS every 10 seconds
sys_interval 10

log_dest stdout
Mosquitto 2.x refuses anonymous clients and listens only on localhost unless you configure a listener, so these settings are required.
mosquitto/config/acl
# Telegraf reads telemetry and broker metrics
user telegraf
topic read fleet/+/+/telemetry
topic read $SYS/#

# The watchdog reads everything under fleet/ and writes alerts
user watchdog
topic read fleet/#
topic write fleet/+/+/alerts

# Every device (username = device ID) can only publish its own topics
pattern write fleet/+/%u/telemetry
pattern write fleet/+/%u/status
pattern read fleet/+/%u/cmd
The %u pattern substitutes the MQTT username. Each device logs in with its device ID as the username, so device01 can publish to fleet/site1/device01/telemetry but cannot spoof device02.
Create the password file with one entry per client. -c creates the file, so use it only for the first entry:
cd mqtt-monitoring
source .env
docker run --rm -v "$PWD/mosquitto/config:/mosquitto/config" eclipse-mosquitto:2 \
  mosquitto_passwd -c -b /mosquitto/config/passwd telegraf "$MQTT_TELEGRAF_PASSWORD"
docker run --rm -v "$PWD/mosquitto/config:/mosquitto/config" eclipse-mosquitto:2 \
  mosquitto_passwd -b /mosquitto/config/passwd watchdog "change-me-watchdog"
docker run --rm -v "$PWD/mosquitto/config:/mosquitto/config" eclipse-mosquitto:2 \
  mosquitto_passwd -b /mosquitto/config/passwd device01 "change-me-device01"
chmod 0700 mosquitto/config/passwd mosquitto/config/acl
Mosquitto 2.1 logs a warning if the password or ACL file is world-readable, and says future versions will refuse to load it, so the chmod matters. To add a device later, run mosquitto_passwd inside the running container, then reload the credentials without dropping connected clients:
docker compose exec mosquitto mosquitto_passwd -b /mosquitto/config/passwd device02 "change-me-device02"
docker compose kill -s HUP mosquitto
Passwords are fine to get started. For production fleets, replace them with per-device X.509 client certificates (mTLS), covered in Step 8.
Step 4: Configure Telegraf to Store MQTT Telemetry in InfluxDB
telegraf/telegraf.conf
[agent]
  interval = "10s"
  flush_interval = "10s"

[[outputs.influxdb_v2]]
  urls = ["http://influxdb:8086"]
  token = "${INFLUX_TOKEN}"
  organization = "iot"
  bucket = "telemetry"

# Device telemetry: fleet/{site}/{device_id}/telemetry  (JSON payload)
[[inputs.mqtt_consumer]]
  servers = ["tcp://mosquitto:1883"]
  topics = ["fleet/+/+/telemetry"]
  qos = 0
  client_id = "telegraf-telemetry"
  username = "telegraf"
  password = "${MQTT_TELEGRAF_PASSWORD}"
  data_format = "json"

  # Turn topic levels into InfluxDB tags: site and device_id
  [[inputs.mqtt_consumer.topic_parsing]]
    topic = "fleet/+/+/telemetry"
    measurement = "_/_/_/measurement"
    tags = "_/site/device_id/_"

# Broker health from Mosquitto's $SYS topics (one numeric value per topic)
[[inputs.mqtt_consumer]]
  servers = ["tcp://mosquitto:1883"]
  topics = [
    "$SYS/broker/clients/connected",
    "$SYS/broker/subscriptions/count",
    "$SYS/broker/load/messages/received/1min",
    "$SYS/broker/load/messages/sent/1min",
  ]
  client_id = "telegraf-sys"
  username = "telegraf"
  password = "${MQTT_TELEGRAF_PASSWORD}"
  name_override = "mosquitto"
  data_format = "value"
  data_type = "float"
Each telemetry message becomes a point in the telemetry measurement. Its numeric JSON keys become fields (cpu, mem, disk, temp, uptime), and site and device_id become tags. Start the stack:
docker compose up -d
docker compose logs -f mosquitto telegraf
You should see Telegraf’s two clients connect as telegraf in the Mosquitto log.
Step 5: Publish Device Telemetry with a Python MQTT Agent
Run this agent on each Linux device, such as a Raspberry Pi, NVIDIA Jetson or industrial gateway. It does three things:
- Registers a retained Last Will of
offlineon its status topic. - Publishes a retained
onlinestatus every time it connects or reconnects. - Sends CPU, memory, disk, uptime and temperature every 30 seconds.
pip install paho-mqtt psutil
device_agent.py
import json
import os
import signal
import socket
import time

import paho.mqtt.client as mqtt
import psutil

BROKER = os.getenv("MQTT_HOST", "127.0.0.1")
PORT = int(os.getenv("MQTT_PORT", "1883"))
SITE = os.getenv("SITE", "site1")
DEVICE_ID = os.getenv("DEVICE_ID", socket.gethostname())
INTERVAL = int(os.getenv("INTERVAL", "30"))  # seconds between telemetry messages (the heartbeat)

BASE = f"fleet/{SITE}/{DEVICE_ID}"
STATUS_TOPIC = f"{BASE}/status"


def cpu_temperature():
    """Return the CPU temperature in °C, or None if the board doesn't expose it."""
    try:
        temps = psutil.sensors_temperatures()
    except AttributeError:  # not supported on this OS
        return None
    for name in ("cpu_thermal", "coretemp", "soc_thermal"):
        if temps.get(name):
            return temps[name][0].current
    return None


def on_connect(client, userdata, flags, reason_code, properties):
    if not reason_code.is_failure:
        # Overwrite the retained "offline" left by a previous Last Will
        client.publish(STATUS_TOPIC, "online", qos=1, retain=True)


def stop(signum, frame):
    # systemd and `docker stop` send SIGTERM; shut down cleanly like Ctrl+C
    raise KeyboardInterrupt


signal.signal(signal.SIGTERM, stop)

client = mqtt.Client(mqtt.CallbackAPIVersion.VERSION2, client_id=DEVICE_ID)
client.username_pw_set(DEVICE_ID, os.environ["MQTT_PASSWORD"])
# The broker publishes this if we vanish without a clean disconnect
client.will_set(STATUS_TOPIC, "offline", qos=1, retain=True)
client.on_connect = on_connect
client.connect(BROKER, PORT, keepalive=60)
client.loop_start()  # background network thread with automatic reconnect

try:
    while True:
        payload = {
            "cpu": psutil.cpu_percent(interval=1),
            "mem": psutil.virtual_memory().percent,
            "disk": psutil.disk_usage("/").percent,
            "uptime": int(time.time() - psutil.boot_time()),
            "interval": INTERVAL,
        }
        temp = cpu_temperature()
        if temp is not None:
            payload["temp"] = round(temp, 1)
        client.publish(f"{BASE}/telemetry", json.dumps(payload), qos=0)
        time.sleep(INTERVAL)
except KeyboardInterrupt:
    # A clean disconnect does NOT trigger the Last Will, so announce it ourselves
    client.publish(STATUS_TOPIC, "offline", qos=1, retain=True).wait_for_publish()
    client.disconnect()
    client.loop_stop()
Run it, then watch the topics from another terminal:
MQTT_HOST=broker.local SITE=site1 DEVICE_ID=device01 MQTT_PASSWORD=change-me-device01 \
  python3 device_agent.py

mosquitto_sub -h broker.local -u watchdog -P change-me-watchdog -t 'fleet/#' -v
# fleet/site1/device01/status online
# fleet/site1/device01/telemetry {"cpu": 7.9, "mem": 38.2, "disk": 41.5, "uptime": 86012, "interval": 30, "temp": 48.3}
In production, run the agent as a systemd service with Restart=always so it starts at boot and recovers from crashes. The SIGTERM handler matters here. systemctl stop and docker stop send SIGTERM, not Ctrl+C, and without the handler the agent would exit without publishing offline. In our tests the broker still published the Last Will right away in that case, because the socket closed without a DISCONNECT, but the clean path is more predictable.
No Python on the device? On an ESP32 or other microcontroller, the same pattern applies with an MQTT library such as PubSubClient or ESP-IDF’s esp-mqtt. Set the Last Will in the connect call, publish online with retain, and publish telemetry on a timer. For a complete ESP32 sketch, and Raspberry Pi metrics such as under-voltage and SD card health, see Monitor Raspberry Pi and ESP32 Devices with MQTT.
Step 6: Detect Offline IoT Devices with Last Will and Heartbeats
Offline detection is the most valuable part of MQTT device monitoring, and also the easiest to get wrong. It needs two independent signals. (For MQTT 5 Will Delay, reboot detection and site-outage grouping, see Detect Offline IoT Devices with MQTT Last Will and Heartbeats.)
| Signal | Catches | Detection time |
|---|---|---|
| Last Will and Testament | Power loss, network drop, crash of the MQTT client | About 1.5 × keepalive (≈ 90 s with keepalive=60; we measured 87 s) |
| Heartbeat timeout | Device still connected but the app is hung or the sensor stopped reporting | Your threshold, e.g. 3 missed intervals, plus the alert grace period |
How the Last Will works:
- The device sends its Will (topic, payload, QoS, retain) inside the CONNECT packet.
- If the broker hears nothing from the device within 1.5 × keepalive, or the TCP connection breaks without a DISCONNECT packet, the broker publishes the Will on the device’s behalf.
- Because the Will is retained, every later subscriber also sees
offlineuntil the device reconnects and publishesonline.
A clean disconnect() deletes the Will without sending it. That’s why the agent above publishes offline itself before shutting down.
A connected but hung process keeps answering keepalive pings from the network thread, so the Last Will never fires. The heartbeat timeout covers that case. This small watchdog handles both signals:
watchdog.py
import json
import os
import threading
import time
import urllib.request

import paho.mqtt.client as mqtt

BROKER = os.getenv("MQTT_HOST", "127.0.0.1")
WEBHOOK_URL = os.getenv("WEBHOOK_URL")  # optional: Slack, Teams or any HTTP endpoint
INTERVAL = 30                    # must match the device telemetry interval
STALE_AFTER = 3 * INTERVAL + 10  # three missed heartbeats, plus some slack

last_seen = {}   # "fleet/site/device" -> last telemetry timestamp
alerted = set()  # devices with an open alert
lock = threading.Lock()


def raise_alert(client, base, state, reason):
    event = {"device": base, "state": state, "reason": reason, "ts": int(time.time())}
    client.publish(f"{base}/alerts", json.dumps(event), qos=1)
    print("ALERT", event)
    if WEBHOOK_URL:
        req = urllib.request.Request(
            WEBHOOK_URL,
            data=json.dumps({"text": f"{base} is {state}: {reason}"}).encode(),
            headers={"Content-Type": "application/json"},
        )
        try:
            urllib.request.urlopen(req, timeout=5)
        except OSError as err:
            print("webhook failed:", err)


def on_connect(client, userdata, flags, reason_code, properties):
    client.subscribe("fleet/+/+/telemetry", qos=0)
    client.subscribe("fleet/+/+/status", qos=1)


def on_message(client, userdata, msg):
    base, kind = msg.topic.rsplit("/", 1)
    with lock:
        if kind == "telemetry":
            last_seen[base] = time.time()
            if base in alerted:
                alerted.discard(base)
                raise_alert(client, base, "recovered", "telemetry resumed")
        elif kind == "status" and msg.payload == b"offline" and not msg.retain:
            # Skip retained messages so a watchdog restart doesn't re-alert old outages
            if base not in alerted:
                alerted.add(base)
                raise_alert(client, base, "offline", "connection lost (Last Will)")


client = mqtt.Client(mqtt.CallbackAPIVersion.VERSION2, client_id="watchdog")
client.username_pw_set("watchdog", os.environ["MQTT_PASSWORD"])
client.on_connect = on_connect
client.on_message = on_message
client.connect(BROKER, 1883, keepalive=60)
client.loop_start()

while True:
    now = time.time()
    with lock:
        for base, seen in last_seen.items():
            if now - seen > STALE_AFTER and base not in alerted:
                alerted.add(base)
                raise_alert(client, base, "stale", f"no telemetry for {int(now - seen)}s")
    time.sleep(10)
Tuning tips:
- Choose keepalive based on the link. Use 60 s on Ethernet or Wi-Fi. On cellular, 120–300 s saves data and battery, but offline detection is slower.
- Avoid alert storms. A site-wide network outage will take many devices offline at once. Group alerts by
sitebefore paging anyone. - Track flapping. Count
online/offlinetransitions per hour. A device that reconnects every few minutes usually has a power, signal or memory-leak problem.
Step 7: Build Grafana Dashboards and Alerts
Open Grafana at http://localhost:3000 (default login admin / admin, which you’ll be asked to change) and add a data source:
- Type: InfluxDB, Query language: Flux
- URL:
http://influxdb:8086 - Organization:
iot, Token: yourINFLUX_TOKEN, Default bucket:telemetry
CPU usage per device:
from(bucket: "telemetry")
  |> range(start: v.timeRangeStart, stop: v.timeRangeStop)
  |> filter(fn: (r) => r._measurement == "telemetry" and r._field == "cpu")
  |> aggregateWindow(every: v.windowPeriod, fn: mean, createEmpty: false)
Because device_id is a tag, Grafana draws one series per device automatically. Duplicate the panel for mem, disk and temp.
Broker health (connected clients and message rate):
from(bucket: "telemetry")
  |> range(start: v.timeRangeStart, stop: v.timeRangeStop)
  |> filter(fn: (r) => r._measurement == "mosquitto")
  |> aggregateWindow(every: v.windowPeriod, fn: last, createEmpty: true)
  |> fill(usePrevious: true)   // $SYS values are only published when they change
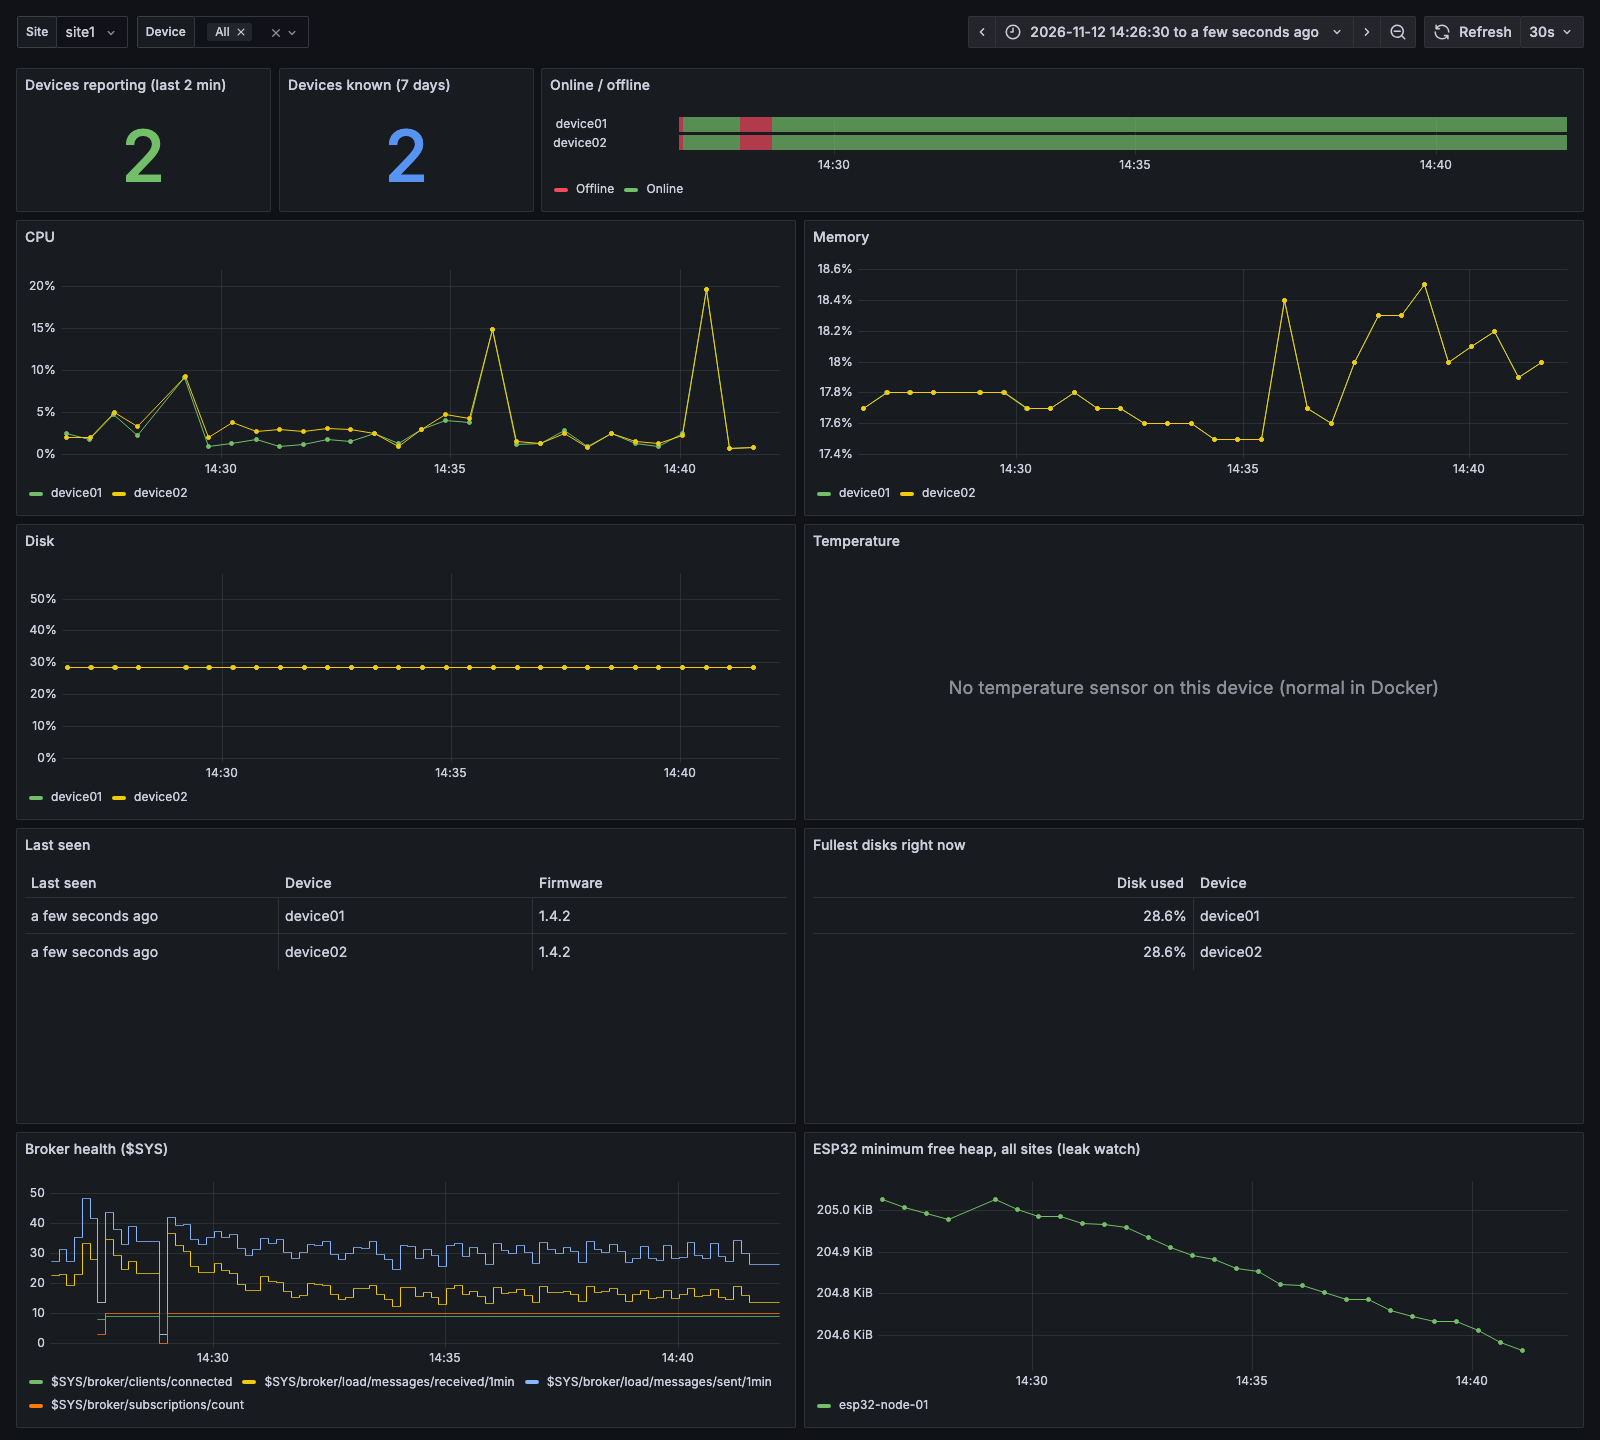
The MQTT IoT Fleet dashboard from the companion repo, running against live data from simulated devices. The red blocks in the timeline are from two broker restarts during testing.
For a full fleet dashboard, with site and device dropdowns, a status timeline, a last-seen table, provisioning and downsampling, see MQTT Grafana Dashboard with Mosquitto, Telegraf and InfluxDB.
Useful Grafana alert rules:
| Alert | Condition | Suggested threshold |
|---|---|---|
| Device not reporting | Query returns No Data for a device | For 5 minutes |
| High CPU | cpu mean | > 90 % for 10 minutes |
| Disk filling up | disk last | > 85 % |
| Overheating | temp last | > 80 °C (Raspberry Pi starts throttling at about 80–85 °C) |
| Broker client drop | clients/connected falls sharply | > 20 % drop in 5 minutes |
Setting the No Data state to Alerting gives you a second, dashboard-level offline check alongside the watchdog.
Monitoring the MQTT Broker with $SYS Topics
When the broker goes down, all monitoring goes with it, so watch the broker too. Mosquitto publishes its own metrics under $SYS/broker/. It checks them every sys_interval seconds and only publishes values that changed, so a steady client count produces few data points. Don’t set a “no data” alert on these series:
| $SYS topic | What it tells you |
|---|---|
$SYS/broker/clients/connected | Devices currently connected. A sudden drop usually means a network or site outage. |
$SYS/broker/subscriptions/count | Total active subscriptions |
$SYS/broker/load/messages/received/1min | Inbound message rate. A drop means devices stopped publishing. |
$SYS/broker/load/messages/sent/1min | Outbound rate to subscribers |
$SYS/broker/uptime | Seconds since the broker started. A reset means it restarted. |
Check them by hand with:
mosquitto_sub -h broker.local -u telegraf -P "$MQTT_TELEGRAF_PASSWORD" -t '$SYS/broker/#' -v
Note that # and + at the start of a subscription do not match $SYS topics, so you have to subscribe to $SYS/... explicitly.
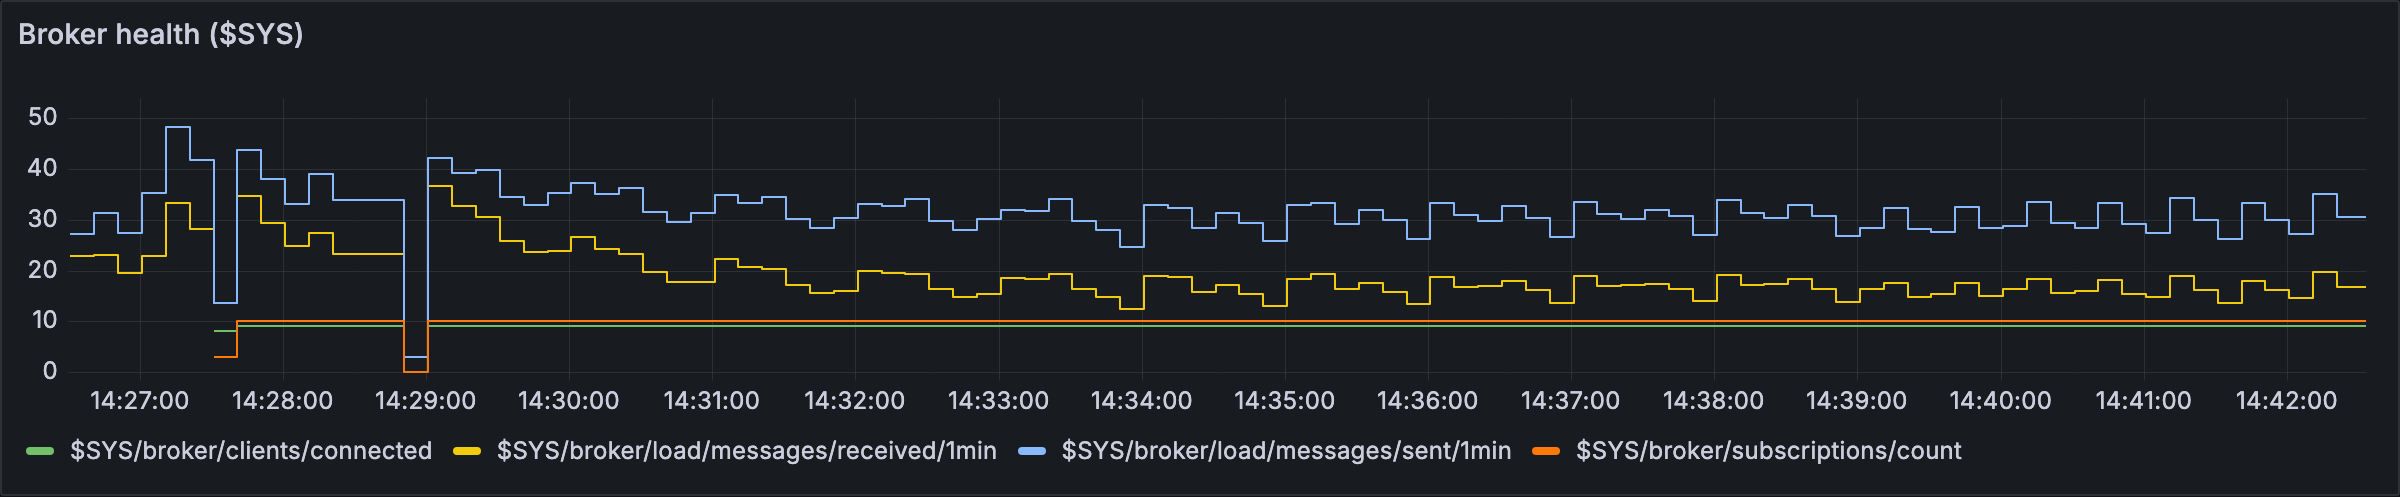
Mosquitto $SYS broker metrics in Grafana. The dips around 14:28 and 14:29 are broker restarts; connected clients and subscriptions recover right away.
Step 8: Secure MQTT Monitoring with mTLS
Port 1883 sends usernames, passwords and telemetry in plain text. Before devices connect over any network you don’t fully control:
- Switch to TLS on port 8883.
- Replace passwords with per-device X.509 client certificates (mutual TLS). A leaked password can be reused from anywhere, while a certificate is bound to a private key that never leaves the device.
- Set
use_identity_as_username truein Mosquitto so the certificate CN becomes the username. The%uACL patterns above then work unchanged.
The SocketXP CLI can issue CA-signed broker and device certificates with a single socketxp ca login command, so you don’t need to run your own OpenSSL CA. Follow the step-by-step guide: MQTT mTLS Authentication Setup with Client Certificates.
How SocketXP Complements Your MQTT Monitoring Setup
The stack above is good at one job: watching. It collects telemetry, charts it and tells you when something is wrong. It can’t act on what it finds. When Grafana shows device01 at 98% disk, or the watchdog reports a device stuck in a reboot loop, the MQTT stack can’t log in to the device, copy its logs off, or ship it a fix.
SocketXP is an IoT device management and remote access platform that covers that second half: remote access, OTA updates and fleet management for the same Linux devices you’re monitoring. It runs alongside your MQTT stack and doesn’t replace it.
MQTT monitoring stack vs SocketXP
| What you need | Self-hosted MQTT monitoring stack | SocketXP |
|---|---|---|
| Custom sensor and app telemetry, Grafana dashboards | ✅ Its core strength | Not the focus; keep using MQTT + Grafana |
| Detect offline or unhealthy devices | ✅ Last Will, heartbeats, alert rules | ✅ Independent agent-based online/offline, CPU, memory, disk, process and log-pattern alerts |
| Log in to a device to troubleshoot | ❌ | ✅ SSH, VNC, RDP or a browser terminal, even behind NAT, CGNAT or cellular, with no VPN or port forwarding |
| Pull logs and config files off a device | ❌ | ✅ SFTP/SCP and a web file browser |
| Run a command across many devices | Only if you build your own cmd topic handlers | ✅ Remote command execution across a device group or the whole fleet |
| Deploy a fix or new version | ❌ | ✅ OTA updates for firmware, application binaries, Debian packages, Docker images and AI models |
| Roll out updates safely | ❌ | ✅ Staged (canary) rollouts, maintenance-window scheduling, rollback through your install script’s health check, per-device status and an audit log |
| Per-device identity and certificates | Build and run your own OpenSSL CA | ✅ Built-in PKI CA: per-device X.509 certificates, mutual TLS, per-device revocation |
| Edge AI devices calling a private LLM | ❌ | ✅ SocketXP AI Gateway |
From alert to fix: how the two work together
- Detect. Grafana or the watchdog flags a problem, for example
site2/device03hasn’t reported for five minutes, or its disk is filling up. - Confirm. SocketXP’s own agent shows whether the whole device is down or only the MQTT client is. The two systems are independent, so you can tell those cases apart.
- Get in. SSH into the device through SocketXP, even though it sits behind a cellular modem with no public IP. Read
journalctl, checkvcgencmd get_throttled, free up disk space or restart the service. - Fix the fleet, not just one device. If the root cause is a bug, package the fix and push it with an OTA update: a pilot group first, then the rest of the fleet once its health checks pass.
- Verify. Watch the same Grafana panels recover, and the
fwtag in the last-seen table change device by device.
MQTT monitoring covers steps 1 and 5. SocketXP covers steps 2 to 4.
OTA updates for the devices you monitor
OTA is the capability the monitoring stack misses most. Without it, every fix found through a dashboard ends with someone visiting the device or improvising a script over SSH. SocketXP delivers any artifact you can install with a shell script: firmware, binaries, .deb packages, Docker images, even the monitoring agent from this guide. It also tracks success or failure per device. See OTA updates for IoT and the OTA update guide.
AIoT: edge AI devices
The same pairing works for edge AI fleets such as NVIDIA Jetson, or a Raspberry Pi with an AI accelerator. MQTT carries inference_ms, fps and model_version into Grafana. SocketXP rolls out new models OTA to a pilot group first, so you can compare inference latency on the dashboard before the full rollout. Devices that need to call a private LLM reach it through the SocketXP AI Gateway, without exposing the model server to the internet.
Also useful: secure connectivity for the stack itself
The same agent can carry the monitoring traffic too. Devices behind NAT can reach a private Mosquitto broker without opening port 1883 or 8883 (see Remote Access MQTT Broker Behind NAT or Firewall). You can also share the local-only Grafana with your team using socketxp connect http://localhost:3000.
SocketXP is available as a cloud service or self-hosted. The self-hosted Enterprise edition is for commercial fleets. A free Community edition covers non-commercial use with up to 100 devices and community-forum support. Either one fits the same keep-it-on-your-own-servers approach as this MQTT stack.
MQTT vs HTTP for IoT Monitoring
| MQTT | HTTP polling / webhooks | |
|---|---|---|
| Connection | One persistent connection per device | New request per reading (or keep-alive) |
| Header overhead | 2-byte minimum fixed header | Hundreds of bytes of headers |
| Direction | Bidirectional (telemetry up, commands down) | Mostly device → server |
| Offline detection | Built in (keepalive + Last Will) | Must be built with timeouts |
| Latest value for new clients | Retained messages | Must query a database |
| Works behind NAT | Yes, the device dials out | Yes for push, no for polling the device |
| Best for | Fleets, frequent telemetry, constrained links | Occasional reports, simple integrations |
Production Checklist
- Anonymous access disabled; per-device credentials or certificates; ACLs scoped with
%u - TLS on 8883, with mTLS for device identity
- Retained
statustopic with a Last Will on every device - Heartbeat watchdog plus a Grafana No Data alert
- Broker
$SYSmetrics charted and alerted - InfluxDB retention policy set (30 days of raw data in this guide), with downsampling for longer history
- Persistence enabled on Mosquitto so retained status survives restarts
- Device agent running under systemd with
Restart=always - Remote access path ready for when an alert needs hands-on troubleshooting
Next Steps
- Make offline alerts reliable: Detect Offline IoT Devices with MQTT Last Will and Heartbeats
- Build the fleet dashboard: MQTT Grafana Dashboard with Mosquitto, Telegraf and InfluxDB
- Monitor specific hardware: Monitor Raspberry Pi and ESP32 Devices with MQTT
- Secure the broker with client certificates: MQTT mTLS Authentication Setup
- Connect devices to a broker behind NAT: Remote Access MQTT Broker Behind NAT or Firewall
- Learn the wider picture: IoT Remote Monitoring: A Comprehensive Guide
- Add device-level alerts and remote SSH to your fleet with SocketXP IoT remote monitoring
Frequently Asked Questions
What is MQTT IoT monitoring?
MQTT IoT monitoring means IoT devices publish health and sensor telemetry (CPU, memory, temperature, sensor readings, online status) to an MQTT broker. Collectors subscribe to those topics, store the data in a time-series database, and drive dashboards and alerts. MQTT suits this because it is lightweight, push-based and works over unreliable networks.
How do I know if an MQTT device is offline?
Use two signals. First, each device registers a retained Last Will and Testament (LWT) message such as 'offline' on its status topic. The broker publishes it automatically if the device disconnects ungracefully or misses its keepalive (after 1.5 times the keepalive interval). Second, track the last telemetry timestamp and flag a device that misses three consecutive intervals, which catches devices that are connected but hung.
Which MQTT QoS level should I use for IoT telemetry?
Use QoS 0 for frequent periodic telemetry, where the next reading replaces a lost one. Use QoS 1 with retain=true for status and Last Will messages, and QoS 1 for alerts and commands that must arrive at least once. QoS 2 is rarely needed for monitoring and adds overhead.
Is Mosquitto good for IoT monitoring?
Yes. Eclipse Mosquitto is a lightweight, fully open-source MQTT broker that runs on anything from a Raspberry Pi to a cloud VM. It is only a broker, so for monitoring you pair it with a collector such as Telegraf or Node-RED, a time-series database such as InfluxDB, and a dashboard tool such as Grafana.
How do I monitor the Mosquitto broker itself?
Mosquitto publishes its own metrics on $SYS topics. It checks them every sys_interval seconds (10 seconds by default) and publishes the values that changed, including $SYS/broker/clients/connected, $SYS/broker/subscriptions/count and $SYS/broker/load/messages/received/1min. Subscribe to them with Telegraf and chart them in Grafana next to your device metrics.
MQTT vs HTTP for IoT monitoring: which is better?
MQTT is usually better for monitoring device fleets. Devices keep one persistent connection and push data with a 2-byte minimum header, instead of opening an HTTP request per reading. MQTT also has built-in offline detection with Last Will and keepalive, and retained messages that give new subscribers the latest status immediately.
What does SocketXP add to an MQTT monitoring setup?
MQTT monitoring collects telemetry and raises alerts, but it can't act on them. SocketXP is an IoT device management and remote access platform that adds the missing half: SSH, VNC, RDP and browser access to devices behind NAT or cellular networks, file transfer, remote commands across the fleet, OTA updates with staged rollouts and rollback, per-device certificates, and independent device health alerts. Keep MQTT and Grafana for telemetry, and use SocketXP to fix and update the devices.
What should I do when MQTT monitoring shows a device is unhealthy?
MQTT tells you something is wrong, but it cannot fix the device. Use a device management and remote access platform such as SocketXP to SSH into the device behind NAT, read logs and restart services. If the fix applies to many devices, push it as an OTA update to a pilot group first, then the rest of the fleet.